
Adding support for observability and logging to my homelab's k8s cluster
In the previous blog post, I described how to configure a basic Kubernetes cluster to deploy real-world workloads. Today, I’ll explore how to add observability to our environment.
Observability plays a central role in modern infrastructure management, granting us invaluable insights into the behavior of our workloads. By collecting metrics and logs, we can proactively monitor, analyze, and troubleshoot the performance and stability of our applications. In this blog post, I will guide you step-by-step through the installation of several free and open-source observability tools: Prometheus, Loki, Fluent Bit, and Grafana.
Prometheus will server as a powerful metric collection and storage tool, enabling us to gather a wide range of metrics from our environment. Fluent Bit will handle the task of gathering logs from our workloads and shipping them to Loki, a log aggregation system designed to store and query logs from all applications and services within the cluster. Finally, Grafana will provide us with an intuitive web interface for visualizing and querying both metrics and logs.
By the end of this post, we’ll have a robust free and open-source observability stack up and running, empowering us with the necessary data to ensure the optimal performance and stability of our applications. Let’s get started!
Prometheus
First and foremost, we need to install Prometheus to collect metrics from all the workloads running within our cluster. The kube-prometheus project](https://github.com/prometheus-operator/kube-prometheus) offers a set of components specifically designed to gather metrics from various Kubernetes components. It also provides preconfigured alerting rules and Grafana dashboards for easy visualization.
Before proceeding with the Prometheus installation, it’s crucial to verify the kubelet configuration and ensure that the the WebHook authentication and authorization modes are enabled. If you followed the guide from the previous post, these configuration parameters should already contain the expected values. However, let’s double-check the kubelet configuration using the following command:
$ kubectl get cm -n kube-system kubelet-config -o yaml
The following attributes must be configured:
    authentication:
      webhook:
        enabled: true
    authorization:
      mode: Webhook
If necessary, the configuration can be changed by editing the kube-system/kubelet-config ConfigMap:
$ kubectl edit cm -n kube-system kubelet-config
After the ConfigMap is changed, the configuration needs to be manually applied by executing the following command in each node:
$ kubeadm upgrade node phase kubelet-config
Now we have all the pre-requisites to install the kube-prometheus stack using the official Helm chart. By default, this chart also deploy several other observability components like AlertManager and Grafana for dashboard visualization. Before applying it, let’s customize the chart a little bit by exposing the Grafana instance outside the cluster with TLS support in a custom domain (again, you need to have a working Ingress instance and a secret with the TLS certificate as shown in the previous post. Create a file called kube-prometheus-values.yaml containing the Ingress configuration as shown in the example below:
grafana:
  ingress:
    enabled: true
    ingressClassName: nginx
    hosts:
    - grafana.k8s.mauriciomaia.dev
    path: /
    tls:
    - secretName: k8s-wildcard-secret
      hosts:
      - grafana.k8s.mauriciomaia.dev
With the file created, apply the chart passing the configuration above:
$ helm repo add prometheus-community https://prometheus-community.github.io/helm-charts
$ helm repo update
$ helm install kube-prometheus prometheus-community/kube-prometheus-stack -f kube-prometheus-values.yaml --namespace kube-prometheus  --create-namespace
After the installation process, check if the all the pods are running by executing:
$ kubectl --n kube-prometheus get pods
Our Grafana instance should be accessible via the DNS specified in the chart configuration. Login to the instance (in our example: https://grafana.k8s.mauriciomaia.dev) with the user admin and password prom-operator (this default password can also be changed in the chart’s configuration).
We should see a ton of dashboards showing details about the Kubernetes’s cluster health:
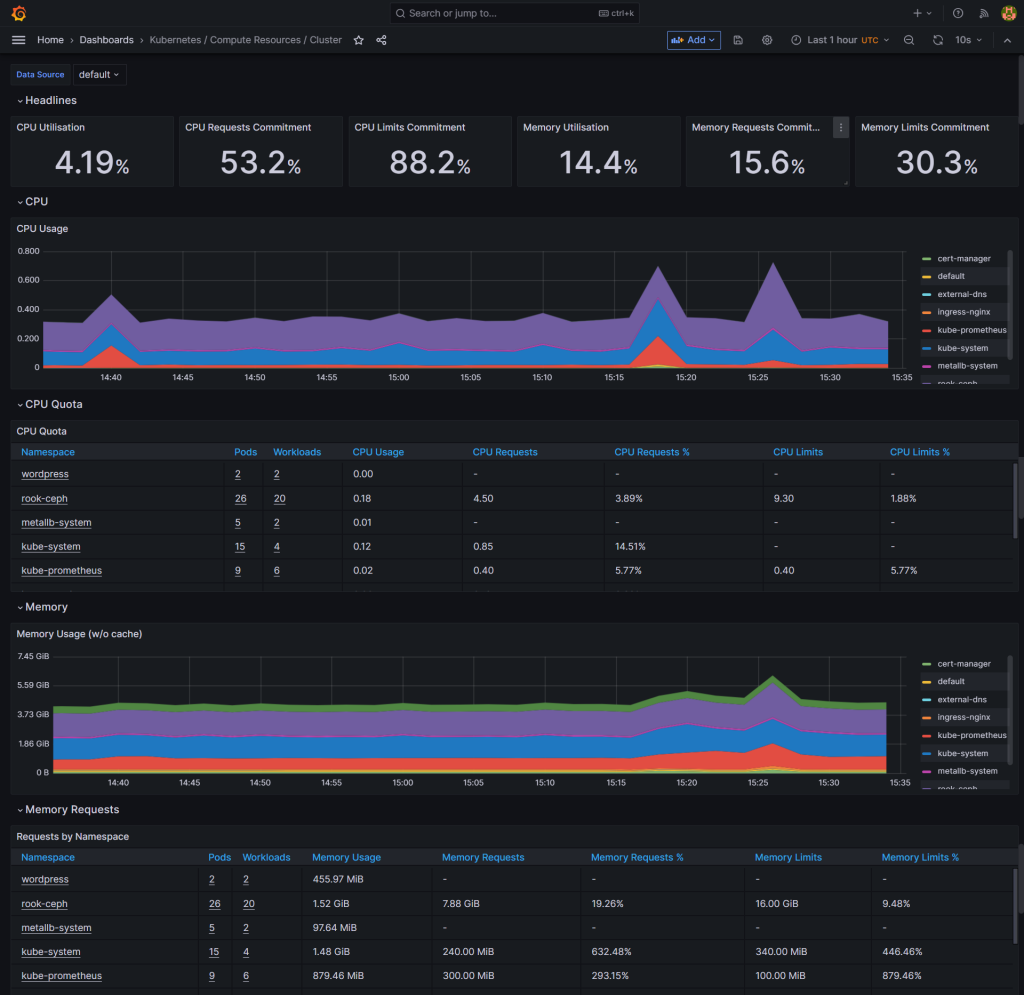
We can also use this Prometheus instance to store custom metrics from any workload inside the cluster.
Logging
Besides metrics, we also want to collect logs from our workloads and ship them to a centralized location for storage and querying. I’m going to deploy a Loki instance to handle log storage and aggregation and Fluent Bit as a log collection tool.
Before configuring our Loki instance, we gonna need a place to store our data. Loki supports shipping data to any S3 compatible service. The Ceph cluster created in the previous post can be used for that purpose.
Apply the following manifest to create a Ceph Object Store Cluster:
apiVersion: ceph.rook.io/v1
kind: CephObjectStore
metadata:
  name: object-store
  namespace: rook-ceph
spec:
  metadataPool:
    failureDomain: host
    replicated:
      size: 3
  dataPool:
    failureDomain: host
    erasureCoded:
      dataChunks: 2
      codingChunks: 1
  preservePoolsOnDelete: true
  gateway:
    sslCertificateRef:
    port: 80
    instances: 1
Wait for the Object Store to be ready:
$ kubectl get CephObjectStore -n rook-ceph
NAME           PHASE
object-store   Ready
With the object store ready, we need to retrieve the endpoint address that will be required in future step:
$ kubectl get cephobjectstore object-store -n rook-ceph -ojsonpath="{.status.endpoints.insecure[0]}{'\n'}"
http://rook-ceph-rgw-object-store.rook-ceph.svc:80
Now lets create a user for our loki instance access the object store server:
apiVersion: ceph.rook.io/v1
kind: CephObjectStoreUser
metadata:
  name: loki
  namespace: rook-ceph
spec:
  store: object-store
  displayName: "Loki Object Store User"
  quotas:
    maxBuckets: 100
    maxSize: 100G
  capabilities:
    bucket: "*"
After creating the user, we can get the credentials from the following secret:
$ kubectl get secret -n rook-ceph rook-ceph-object-user-object-store-loki -ojsonpath='{.data.AccessKey}' | base64 -d | xargs printf "%s\n"
0MSTWY1SBWHHNT3VQUQB
$ kubectl get secret -n rook-ceph rook-ceph-object-user-object-store-loki -ojsonpath='{.data.SecretKey}' | base64 -d | xargs printf "%s\n"
g7IrQAqGEp67jNkYhaBblsqrUe2rJeczkbxkeQqm
We are going to need 3 buckets to store the log data. Although it is possible to create the buckets via an ObjectBucketClaim CRD, at this moment, the resource’s API does not support assigning the same user or owner to multiple buckets. To workaround this restriction, we are going to create these buckets manually using the Ceph dashboard. Create 3 buckets as shown in the image, all owned by the user ‘loki’ created before.
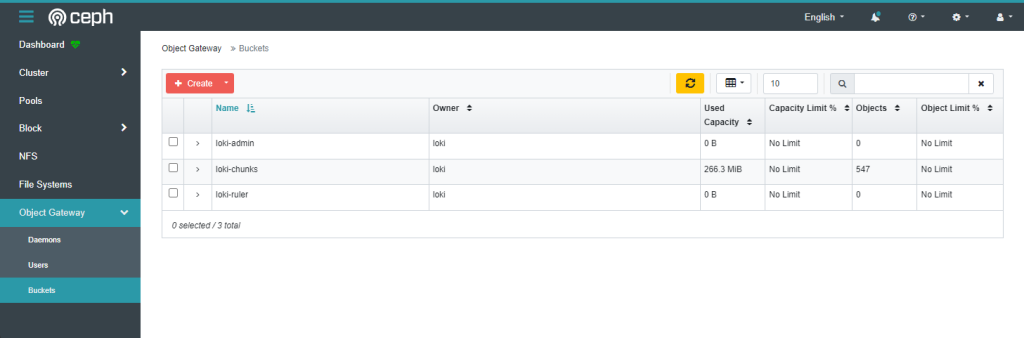
This step can also be automated using the AWS S3 cli:
aws s3api create-bucket --bucket loki-admin --region default
aws s3api create-bucket --bucket loki-chunks --region default
aws s3api create-bucket --bucket loki-ruler --region default
With the buckets created, we have all the pre-requistes to start our Loki instance using the Loki Operator. Create a file to hold configuration for the chart with the following data (replacing the credentials and endpoint by your the data from your environment):
loki:
  auth_enabled: false
  commonConfig:
    replication_factor: 3
  storage:
    bucketNames:
      admin: "loki-admin"
      chunks: "loki-chunks"
      ruler: "loki-ruler"
    type: 's3'
    s3:
      endpoint: http://rook-ceph-rgw-object-store.rook-ceph.svc:80
      secretAccessKey: g7IrQAqGEp67jNkYhaBblsqrUe2rJeczkbxkeQqm
      accessKeyId: 0MSTWY1SBWHHNT3VQUQB
      s3ForcePathStyle: true
singleBinary:
  replicas: 3
  persistence:
    enabled: true
    storageClass: 'rook-ceph-block'
Run the following command to install the operator and configure the Loki instance:
$ helm repo add grafana https://grafana.github.io/helm-charts
$ helm repo update
helm install --values loki-values.yaml loki grafana/loki --namespace loki --create-namespace
After installing the chart, check if the Loki pods are all running:
$ kubectl get pods -n loki
NAME                                           READY   STATUS    RESTARTS       AGE
loki-0                                         1/1     Running   0              21m
loki-1                                         1/1     Running   0              21m
loki-2                                         1/1     Running   0              21m
loki-logs-7sgzs                                1/1     Running   0              21m
loki-logs-ct4zq                                1/1     Running   0              21m
loki-logs-mhglh                                1/1     Running   0              21m
Loki will give us a place to store our logs, but we still need something to capture and send the log stream to the Loki service. Now is when Fluent Bit comes into the scene.
The Fluent Bit project provides us with a helm chart that allows us to easily deploy log collection to a Kubernetes cluster. For the sake of simplicity, I’ve decided to use this chart instead of using a logging operator, like the fluent-operator. The operator supports more advanced deployments and it includes Fluentd if more complex routing and parsing logic is required. My environment is small and resource constrained, so I think Fluent Bit should be enough for my needs.
Create a configuration file called fluent-bit-values.yaml with the following values:
config:
  inputs: |
    [INPUT]
        Name tail
        Path /var/log/containers/*.log
        DB /db/tail.db
        multiline.parser cri
        Tag kube.*
        Mem_Buf_Limit 5MB
        Skip_Long_Lines On

    [INPUT]
        Name systemd
        Tag host.*
        DB /db/journald.db
        Systemd_Filter _SYSTEMD_UNIT=kubelet.service
        Systemd_Filter _SYSTEMD_UNIT=containerd.service
        Read_From_Tail On

  filters: |
    [FILTER]
        Name kubernetes
        Match kube.*
        Kube_URL https://kubernetes.default.svc:443
        Kube_CA_File /var/run/secrets/kubernetes.io/serviceaccount/ca.crt
        Kube_Token_File /var/run/secrets/kubernetes.io/serviceaccount/token
        Kube_Tag_Prefix kube.var.log.containers.
        Merge_Log On
        K8S-Logging.Parser On
        K8S-Logging.Exclude On

  outputs: |
    [OUTPUT]
        name loki
        match *
        host loki.loki.svc
        labels job=fluentbit
        remove_keys kubernetes
        label_map_path /fluent-bit/etc/conf/labelmap.json
        auto_kubernetes_labels on

  extraFiles:
     labelmap.json: |
       {
          "stream": "stream",
          "kubernetes": {
            "container_name": "container",
            "namespace_name": "namespace",
            "pod_name": "pod",
            "labels": {
                "app": "app"
            }
          }
       }

extraVolumes:
- name: db
  hostPath:
    path: /var/lib/fluent-bit/

extraVolumeMounts:
- mountPath: /db
  name: db

tolerations:
  - key: node-role.kubernetes.io/control-plane
    operator: Exists
    effect: NoSchedule
  - key: node-role.kubernetes.io/master
    operator: Exists
    effect: NoSchedule
This configuration should configure our Fluent Bit as a DaemonSet collecting all container’s logs running inside the cluster and also collects each host’s kubelet and containerd systemd logs. The configuration outputs all logs to our Loki instance, adding some labels to the records like the pod and namespace name for example (I’m also adding my custom k8s label app as a Loki label to help me search for logs from specific applications running under the cluster). The configuration also persists the tail position databases in the hostś filesystem and adds a toleration to also run the log collection tool in the control plane nodes.
Let’s start the Fluent Bit instances by applying the chart:
$ helm install fluent-bit fluent/fluent-bit --create-namespace -n fluentbit -f fluentbit-values.yaml
Check if all the pods were deployed succesfully:
$ kubectl get daemonset -n fluent
NAME         DESIRED   CURRENT   READY   UP-TO-DATE   AVAILABLE   NODE SELECTOR   AGE
fluent-bit   4         4         4       4            4           <none>          103s
This should be enough to start sending all containers output to our Loki instance.
The next step is to add our Loki instance as a datasource to our existing Grafana instance.
This can be done directly in the Grafana web interface by manually configuring the new datasource:
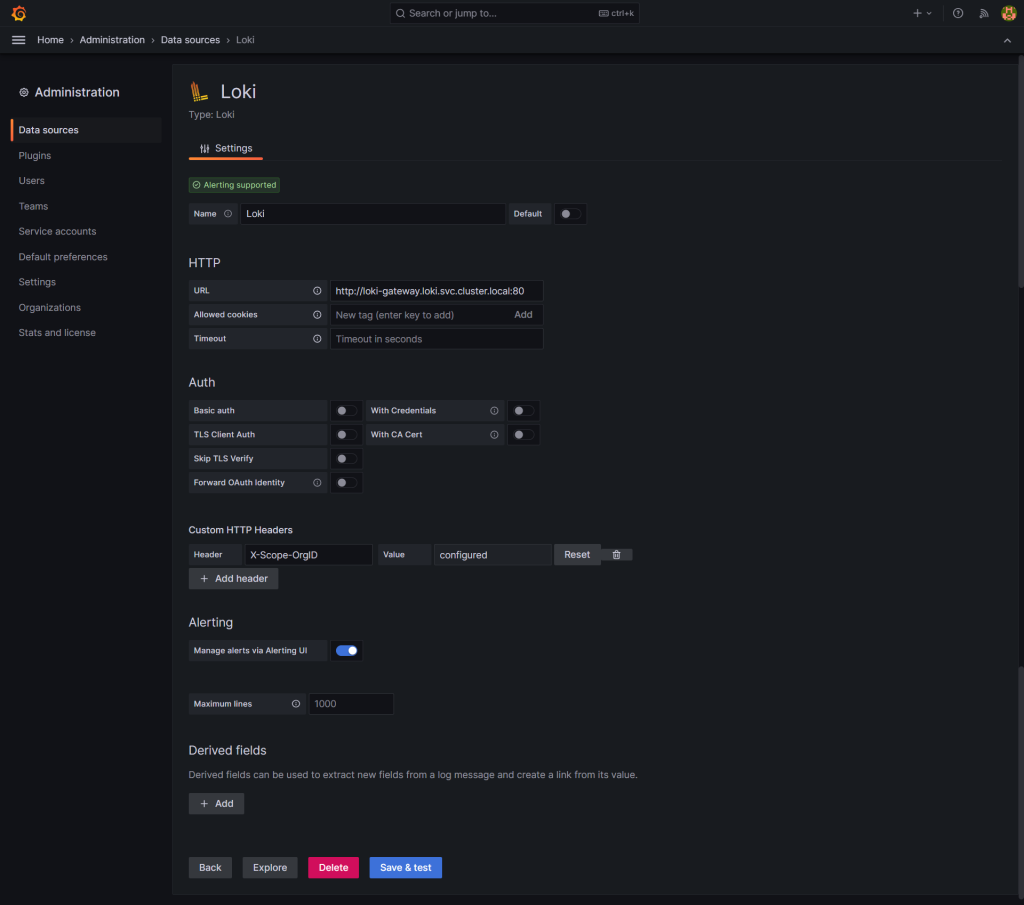
Or through the prometheus-operator Helm chart by adding an additional datasource to the chart configuration with:
additionalDatasources:
    - name: Loki
      type: loki
      isDefault: false
      access: proxy
      url: http://loki-gateway.loki.svc.cluster.local:80
      version: 1
If any error appears after adding the datasource, check the Loki docs for troubleshooting tips.
Now let’s query the logs by acessing Grafana, going to the “Explore” menu and selecting the new “Loki” datasource:
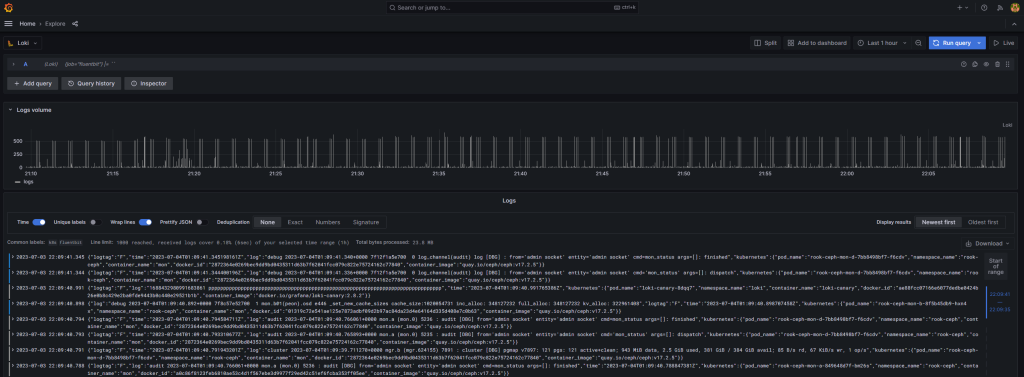
I hope this guide has provided you with a solid foundation for implementing observability in your Kubernetes cluster. By now, you should have a comprehensive observability stack that empowers you to monitor, analyze, and troubleshoot your cluster with ease.
Back to top ↑